Note
Go to the end to download the full example code.
Retrieval of elevation profiles
This example shows how to compute and plot elevation profiles.
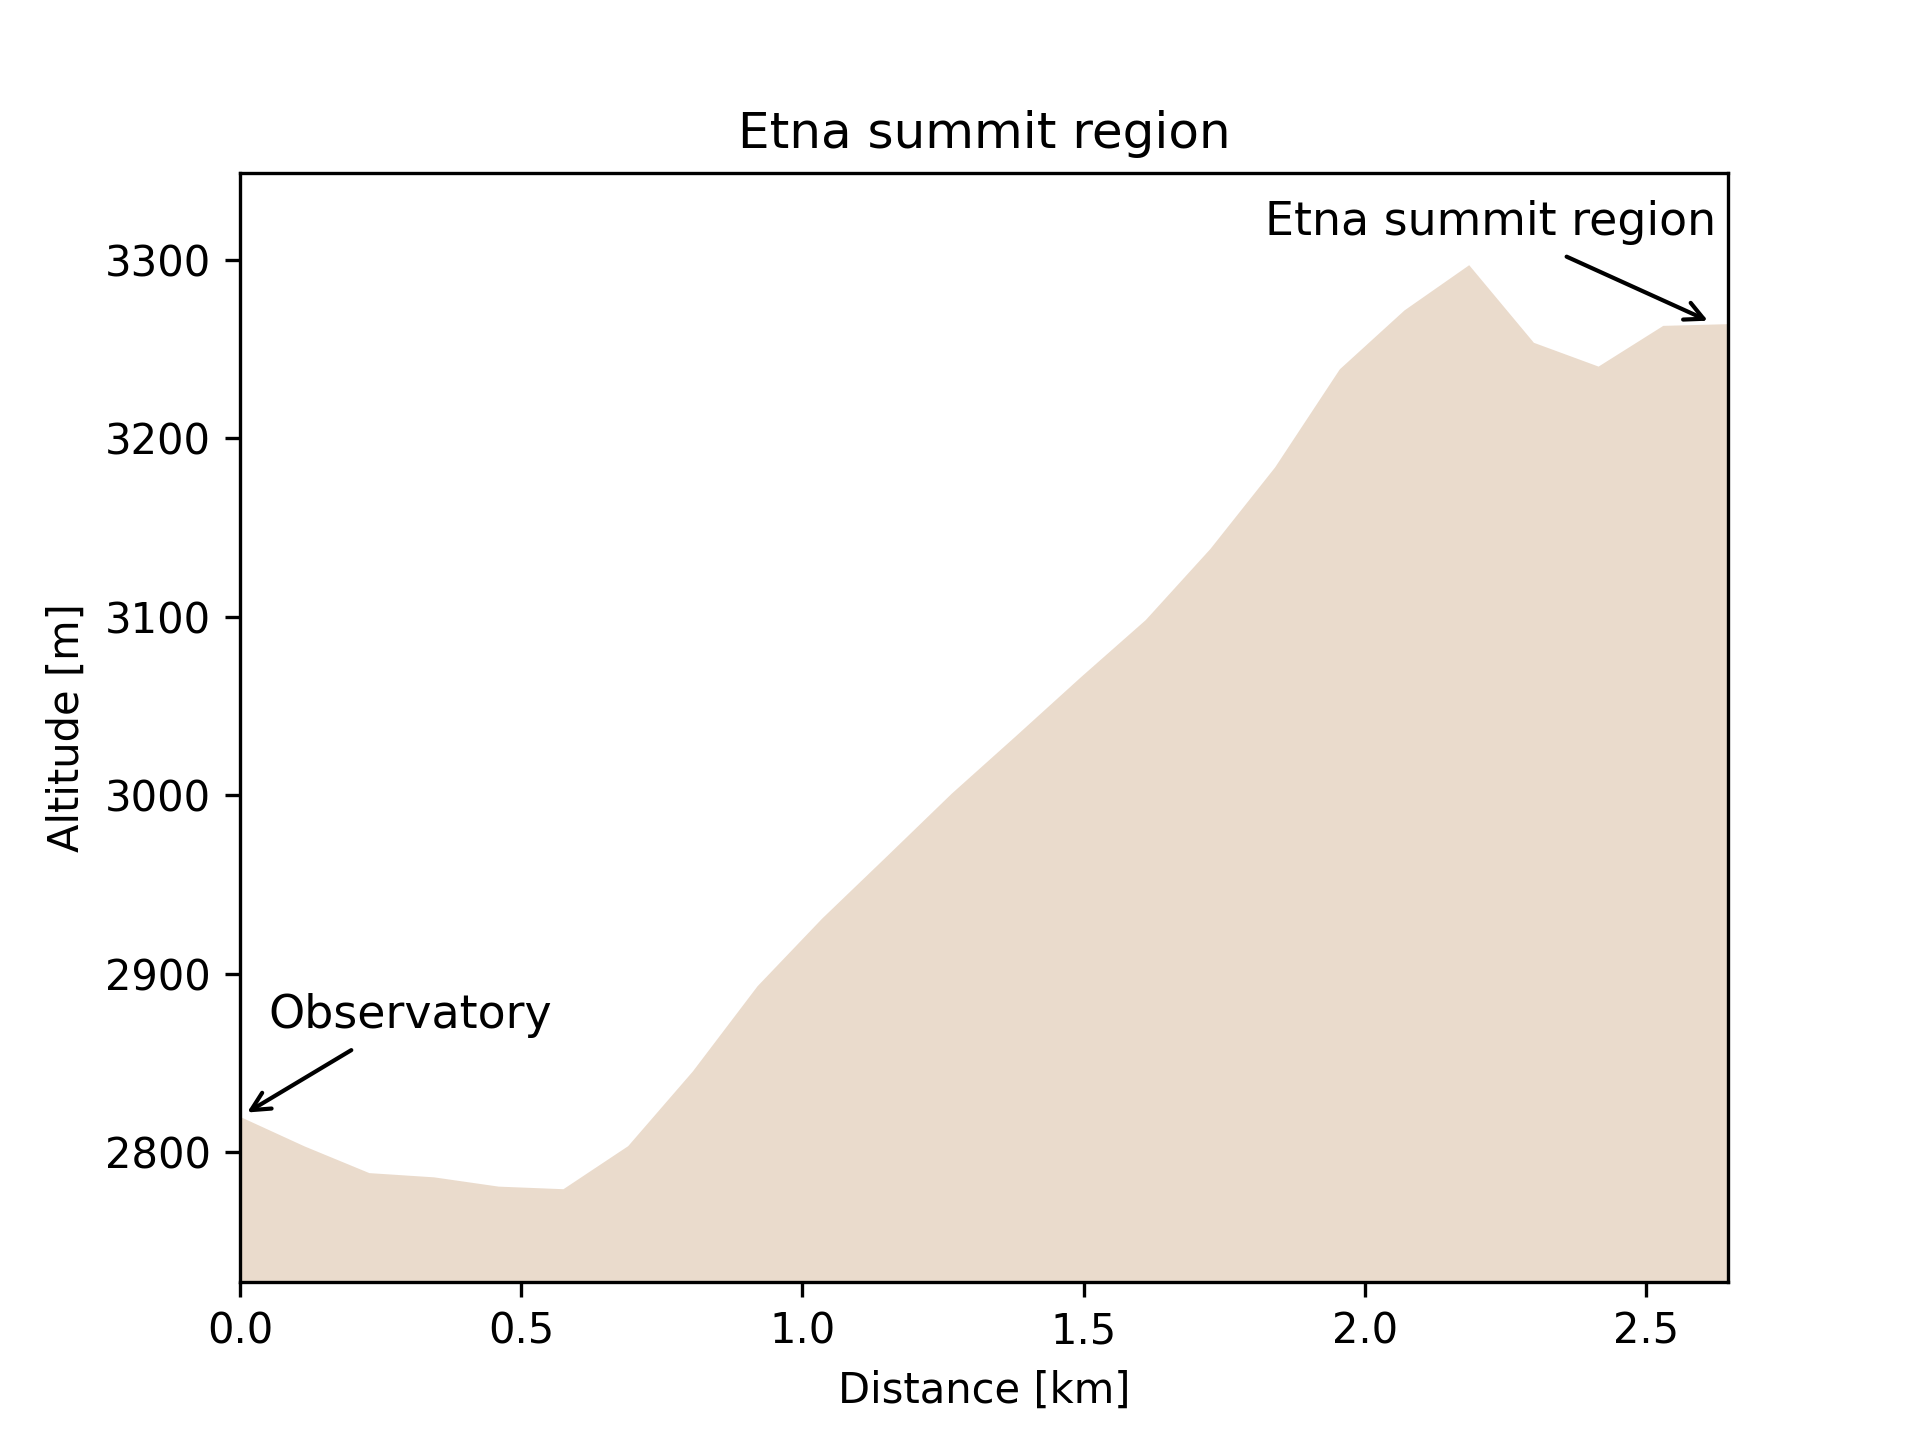
Elevation profiles are computed between 2 locations which are specified by the user. In this example, the volcano Mt. Etna is used to compute the elevation profile between the Etna volcano observatory and the summit region with the active craters.
This script guides through some of the core features of geonum, including:
GeoPoint class
GeoVector3D class
Topographic data access
Domain setup (GeoSetup class)
Computation and plotting of elevation profiles
import matplotlib
matplotlib.rcParams['savefig.dpi'] = 300
import geonum
Define 2 locations for retrieval of elevation profile
Summit region of Mt. Etna
etna = geonum.GeoPoint(latitude=37.751005,
                       longitude=14.993435,
                       altitude=3264.0,
                       name="Etna summit region")
Position of volcanological observatory of Mt. Etna
observatory = geonum.GeoPoint(latitude=37.765755,
                              longitude=15.016696,
                              auto_topo_access=True,
                              name="Observatory")
Retrieving SRTM data (this might take a while) ...
Define regional domain that includes both locations
Regional domains can be specified using the GeoSetup class
domain = geonum.GeoSetup(points=[etna, observatory])
Get lower left and upper right corner coordinates of domain
pll = domain.ll
ptr = domain.tr
Access topographic data for domain
Instantiate topo data access class for SRTM access
topo_access = geonum.TopoDataAccess(mode='srtm')
Retrieve topographic data within domain ranges
topo_data = topo_access.get_data(lat0=pll.latitude, lon0=pll.longitude,
                                 lat1=ptr.latitude, lon1=ptr.longitude)
Retrieving SRTM data (this might take a while) ...
Retrieve elevation profile between 2 locations
Instantiate class ElevationProfile with Etna Observatory as start point and Etna summit as end point and provide topographic data
eprof = geonum.ElevationProfile(observer=observatory,
                                endpoint=etna,
                                topo_data=topo_data)
Calculate elevation profile
altitudes = eprof.det_profile(interpolate=False)
Retrieved altitude values along profile
print(altitudes)
[2820.         2803.38434985 2788.4426275  2786.07415648 2780.87029164
 2779.4304659  2803.53717071 2845.40720928 2893.13123799 2931.05228895
 2965.86139849 3000.92669324 3033.39393452 3066.25692462 3098.21839842
 3138.07633286 3183.76697416 3238.69112989 3271.69199096 3297.02164997
 3253.55858007 3240.22676008 3263.04325754 3264.        ]
Corresponding (horizontal) distances in km, to start point of profile
print(eprof.dists)
[0.         0.11502853 0.23005706 0.34508558 0.46011411 0.57514264
 0.69017117 0.8051997  0.92022822 1.03525675 1.15028528 1.26531381
 1.38034234 1.49537086 1.61039939 1.72542792 1.84045645 1.95548498
 2.0705135  2.18554203 2.30057056 2.41559909 2.53062762 2.64565614]
Plot the profile
On the x-axis, the distances are plotted, and on the y-axis, the corresponding altitude values that were retrieved from the SRTM dataset.
ax = eprof.plot()

# add title
ax.set_title('Etna summit region')

# Add name of the observatory location to the plot
ax.annotate(observatory.name,
            xy=(0, observatory.altitude), # location of observatory in plot
            xytext=(0.05, observatory.altitude+50), # location of text
            arrowprops=dict(color='black', lw=1, arrowstyle='->', ),
            ha='left', size=11
            )

# Get vector connecting the 2 locations
diffvec = etna-observatory

# Get horizontal distance of summit from observatory
summit_dist = diffvec.dist_hor

# Add name of summit region to the plot
_ = ax.annotate(etna.name,
            xy=(summit_dist, etna.altitude), # location of observatory in plot
            xytext=(summit_dist-0.8, etna.altitude+50),
            arrowprops=dict(color='black', lw=1, arrowstyle='->', ),
            ha='left', size=11
            )
Total running time of the script: (0 minutes 0.153 seconds)