Example scripts
On this page, some example scripts are presented, the scripts are shipped with the code.
Example 1 - Basic objects (GeoPoint, GeoVector3D)
Code
"""geonum example script 1

Introduction into the geonum base classes GeoPoint and GeoVector3D
"""

from geonum import GeoPoint

### Create 2 GeoPoint objects

# Summit region of Mt. Etna
p1 = GeoPoint(latitude=37.751005, longitude=14.993435,
              altitude=3264.0, name="Etna")

# Position of volcanological observatory of Mt. Etna
p2 = GeoPoint(latitude=37.765755, longitude=15.016696,
              auto_topo_access=True,
              name="Observatory")

# Print info (string represenation of both points")
print(("Point1: %s, point 2: %s" %(p1, p2)))

# Get and print the connection vector of both points
connection_vector = p2 - p1

print(connection_vector)
# Output:
# GeoVector3D Etna->Observatory
# Azimuth: 51.38°, Elevation: -9.6064°, Magnitude: 2.66 km (hor: 2.62 km)
Example 2 - Introduction GeoSetup
Code
"""geonum example script 2

Introduction into the GeoSetup class
"""

from geonum import GeoPoint, GeoVector3D, GeoSetup, BASEMAP_AVAILABLE
from matplotlib.pyplot import close

def create_geosetup():
    s = GeoSetup()

    # Create two GeoPoints called source and cam, for both points
    # retrieve topographic altitude via "auto_topo_access"
    source = GeoPoint(37.751005,  14.993435, name="source",
                      auto_topo_access=True)

    camera = GeoPoint(37.73122,  15.1129, name="cam", auto_topo_access=True)

    # Add the two GeoPoints to the GeoSetup
    s.add_geo_points(source, camera)
    s.set_borders_from_points()

    # Create vector anchored at source pointing south with horizontal
    # orientation (elevation angle 0)
    plume = GeoVector3D(azimuth=180, dist_hor=s.magnitude,
                        elevation=0, anchor=source, name="plume")

    # Create viewing direction vector anchored at cam pointing west
    # at elevation angle of 8deg
    view_dir = GeoVector3D(azimuth=270, dist_hor=s.magnitude,
                           elevation=8, anchor=camera, name="cam_view")

    # Add the two GeoVectors to the GeoSetup class
    s.add_geo_vectors(plume, view_dir)

    # return the GeoSetup
    return s

def plot_geosetup(geosetup):
    # Plot 2D and 3D overview maps of GeoSetup
    map2d = geosetup.plot_2d()
    map3d = geosetup.plot_3d()

    return map2d, map3d

if __name__ == "__main__":
    close("all")
    # see function definition for example code
    s = create_geosetup()

    if BASEMAP_AVAILABLE:
        map2d, map3d = plot_geosetup(s)
Output figures
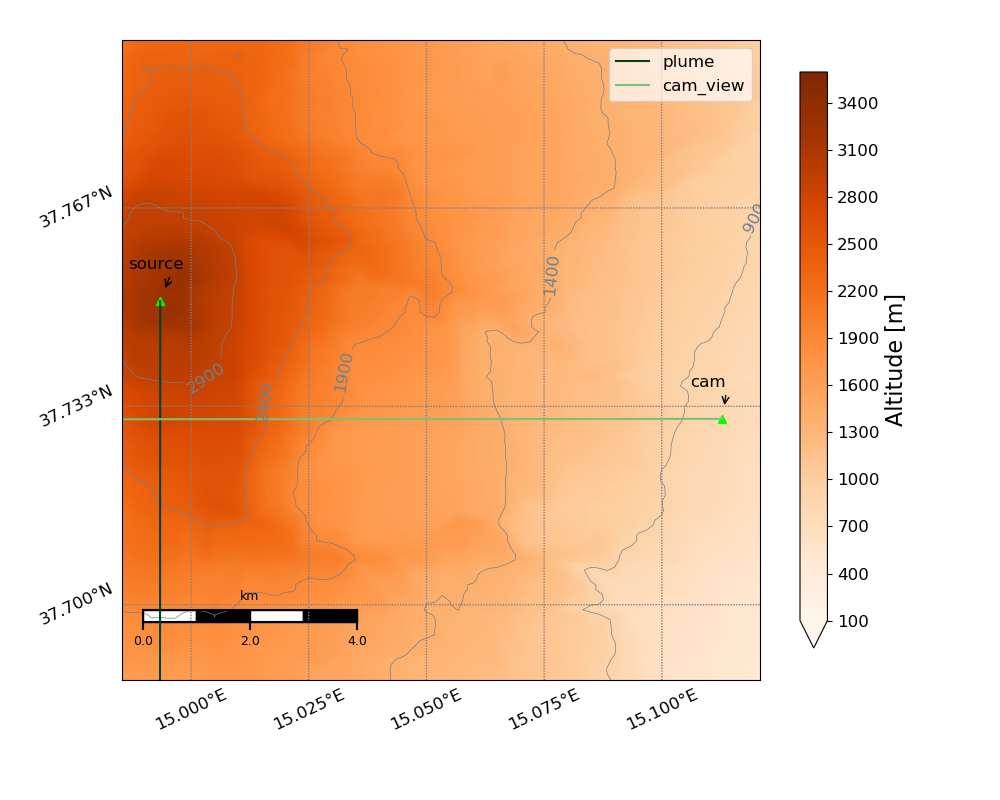
Example 2, Fig. 1: 2D overview map of GeoSetup (Etna volcano)
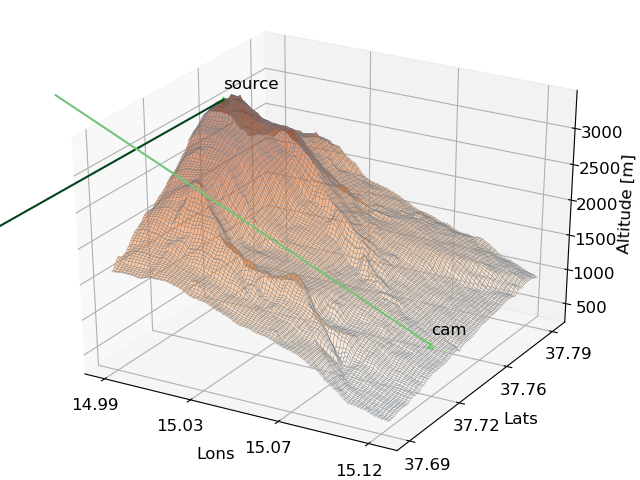
Example 2, Fig. 2: 3D overview map of GeoSetup (Etna volcano)
Example 3 - Mapping and plotting
Code
# -*- coding: utf-8 -*-
"""
geonum example script 3

Creating basemaps including topographic data and some further features
(i.e. draw stuff into a map)
"""

import geonum
from numpy import mean
from matplotlib.pyplot import close, subplots

def create_map_and_load_topodata():
    """Create and return map object around Guallatiri volcano"""
    # coordinate range of map
    lat0 = -18.48
    lon0 = -69.15
    lat1 = -18.39
    lon1 = -69.05

    # trivial ...
    lat_center = mean([lat0, lat1])
    lon_center = mean([lon0, lon1])

    # Create a map object - the Map class is initialised as Basemap object
    # and is extended by some features
    m = geonum.mapping.Map(projection="lcc", llcrnrlat=lat0,
                           llcrnrlon=lon0, urcrnrlat=lat1, urcrnrlon=lon1,
                           lat_0=lat_center, lon_0=lon_center)

    # Compared to a normal Basemap object, a geonum Map can directly access
    # and include SRTM topographic data
    m.load_topo_data("srtm")

    return m

def add_points_and_plot_map(basemap):
    """Add some points and plot in 2d and 3d"""
    basemap.draw_topo_3d()

    # create a geopoint for Guallatiri summit region
    # (here, altitude is set manually)
    summit = geonum.GeoPoint(latitude=-18.423672, longitude=-69.090369,
                             altitude=6071.0, name="Guallatiri")

    # draw this point and a text into the map
    basemap.draw_geo_point_3d(summit)
    basemap.draw_text_3d(lon=-69.090369, lat=-18.423672, alt=6100.0,
                         text="Guallatiri", color="k")
    basemap.ax.set_title("Overview map Guallatiri volcano")

    # create two more objects (without specifying altitude -> is retrieved
    # automatically from topo data)
    p1 = geonum.GeoPoint(-18.45, -69.12, name="Tourist (breathing hard)",
                         auto_topo_access=True)
    p2 = geonum.GeoPoint(-18.40, -69.12, name="Llamas",
                         auto_topo_access=True)


    # points can also be drawn directly into the map (here including the
    # name which is placed 50 m above the topographic altitude of Tourist)
    p1.plot_3d(basemap, add_name=True, dz_text=50)
    p2.plot_3d(basemap, add_name=True, dz_text=50)

    # You can include a polygon connecting different points
    basemap.add_polygon_3d([summit, p2, p1], color="lime")

    # just some little adjustment of the 3D viewing direction
    basemap.ax.view_init(20, 240)

    fig, ax = subplots(1,1)

    # update the axes object in the map
    basemap.ax = ax
    basemap.draw_topo() # draws topography into 2D map
    basemap.draw_topo_contour()

    basemap.draw_coordinates()
    basemap.draw_mapscale_auto()
    p1.plot_2d(basemap, add_name=True)
    p2.plot_2d(basemap, add_name=True)

    summit.plot_2d(basemap, add_name=True, dist_text=1.0, alpha=0.2,
                   angle_text=170, c="y")

    # You can include a polygon connecting different points (for whatever
    # reason)
    basemap.add_polygon_2d([summit, p2, p1], fc="lime", alpha=0.2)

if __name__ == "__main__":
    close('all')
    if not geonum.BASEMAP_AVAILABLE:
        print('Cannot run example script 3. Basemap is not installed')
    else:
        m = create_map_and_load_topodata()
        add_points_and_plot_map(m)
Output figures
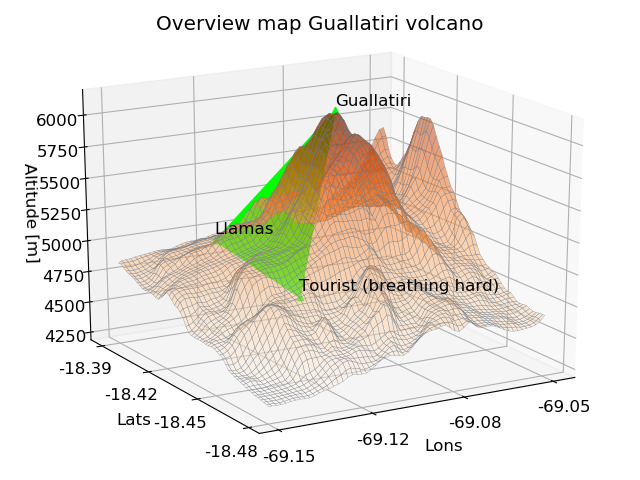
Example 3, Fig. 1: Exemplary 3D overview map for Guallatiri volcano
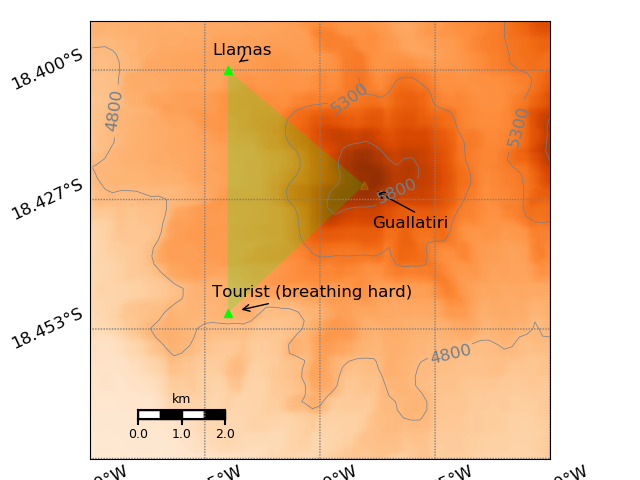
Example 3, Fig. 2: Exemplary 2D overview map for Guallatiri volcano
Example 4 - Elevation profiles and topographic analysis
Code
"""geonum example script 4

Elevation profiles and directional topographic analysis
"""

from matplotlib.pyplot import subplots

### Imports from other example scripts
from ex2_geosetup_intro import create_geosetup

if __name__ == "__main__":
    # create Etna GeoSetup from example 2
    s = create_geosetup()

    # get camera
    cam = s.points["cam"]
    print(cam)

    # calculate elevation profile between camera and source (Etna summit)
    # the camera altitude is 15 m above topography
    profile = cam.get_elevation_profile(geo_point=s.points["source"])

    (dist,
     dist_err,
     intersect,
     view_elevations,
     ax)= profile.get_first_intersection(elev_angle=10.0,
                                         view_above_topo_m=15.0,
                                         plot=True)

    # Find the elvation angle corresponding to the horizon from the
    # elevation profile
    elev, elev_secs, dist_secs = profile.find_horizon_elev(elev_start=10.0,
                                                           elev_stop=20.0,
                                                           step_deg=0.1,
                                                           view_above_topo_m=15.0)

    fig, ax = subplots(1,1)
    ax.plot(elev_secs, dist_secs, "--x")
    ax.set_xlabel("Elevation angle [deg]")
    ax.set_ylabel("Retrieved distances [km]")
    ax.set_title("Elev horizon: %s" %elev)
Output figures
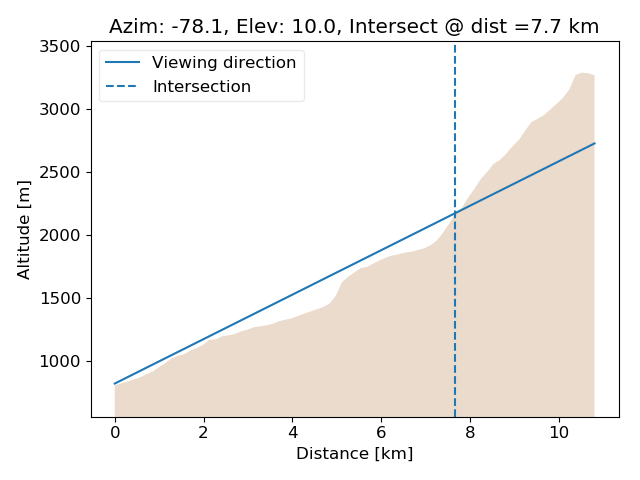
Example 4, Fig. 1: Exemplary elevation profile for GeoSetup from Ex.1 determined along azimuth angle connecting camera and summit including retrieval of intersection with topography for viewing elevation angle of 10 deg.
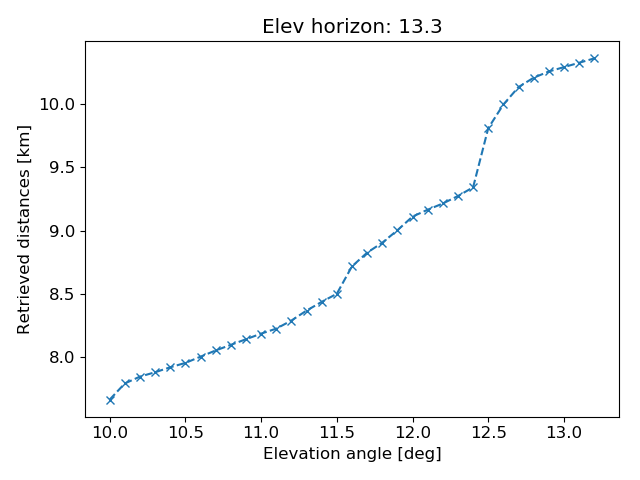
Example 4, Fig. 2: Result from horizon search routine for profile shown in Fig. 1
Example 5 - Topography data access
Code
"""geonum example script 5

Low level access to topographic data (here SRTM) using the example of
Oslo (Norway).

Note
----
Very short example, does not provide the deepest insights but gives an idea

"""
import geonum

if __name__ == "__main__":
    topo_access = geonum.TopoDataAccess(mode='srtm')
    topodata = topo_access.get_data(59.8728, 10.375, 60.026, 10.9144)
    my_old_flat = geonum.GeoPoint(59.919386, 10.714970,
                                  name="Somewhere in Oslo",
                                  auto_topo_access=True)

    if geonum.BASEMAP_AVAILABLE:
        basemap = topodata.plot_2d()
        basemap.ax.set_title("SRTM topo data Oslo")
        basemap.draw_mapscale_auto()


        my_old_flat.plot_2d(basemap, add_name=True)
Output figures
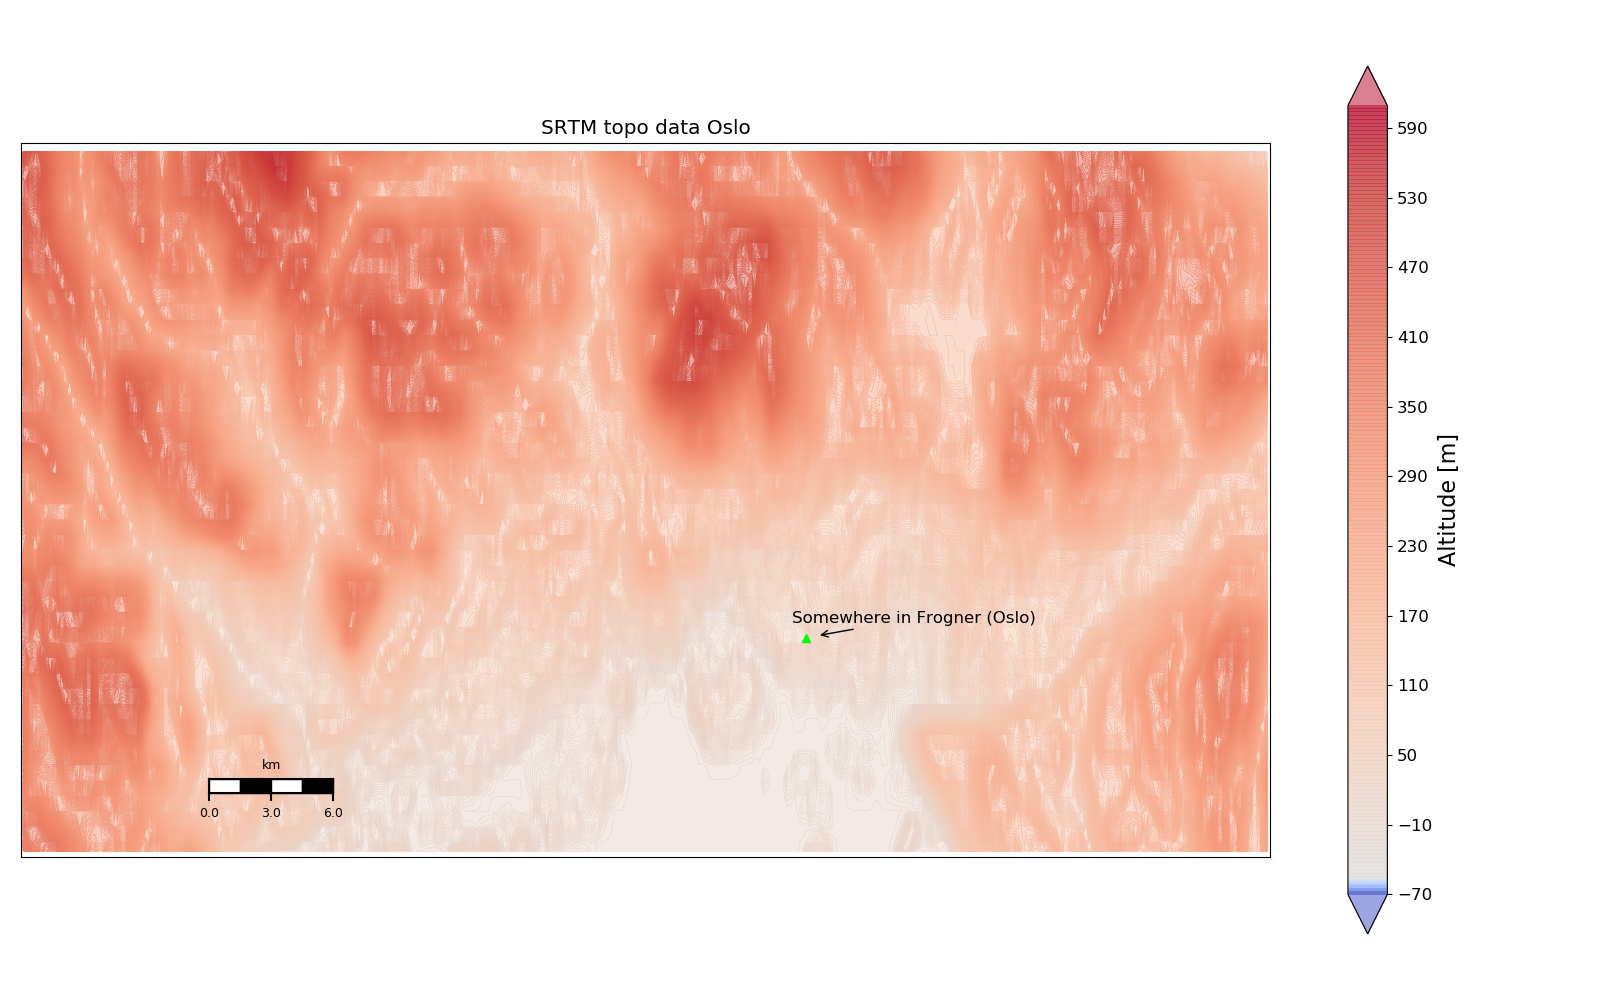
Example 5, Fig. 1: Overview map of Oslo area, Norway (SRTM dataset has some gaps here)