Note
Go to the end to download the full example code.
Introduction to GeoSetup class
import matplotlib
matplotlib.rcParams['savefig.dpi'] = 300
import geonum
Define domain
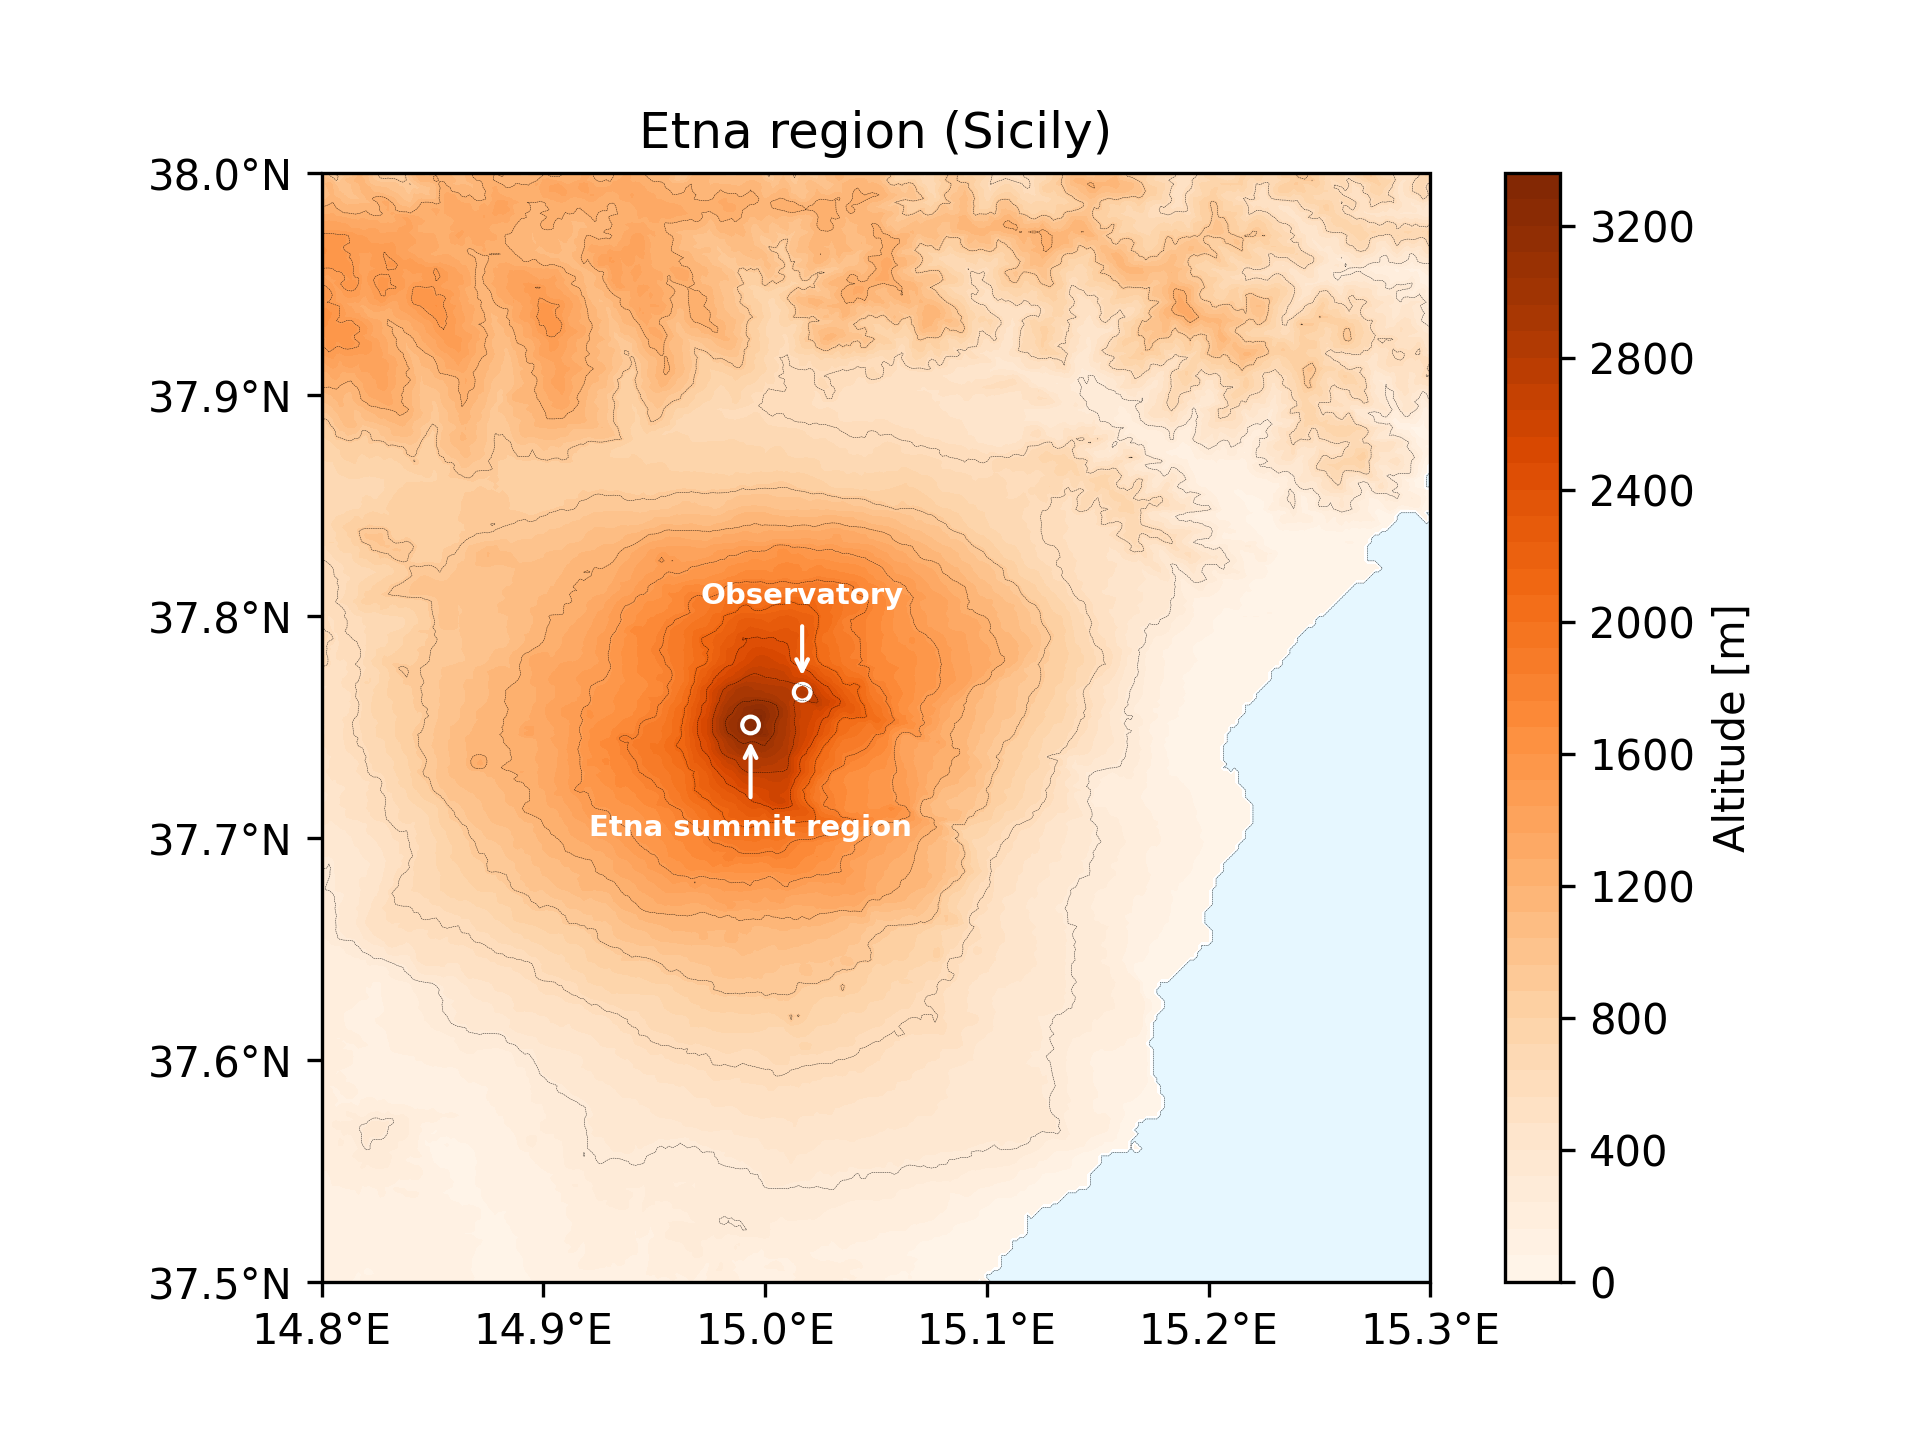
Create instance of Geosetup and specify domain by providing latitude and longitude of lower left (ll) and top right (tr) coordinates. Here, the summit region of the volcano Mt. Etna, Sicily, is used as an example.
from geonum.plot_helpers import plot_topo_contourf

domain = geonum.GeoSetup(id='Etna region (Sicily)',
                         lat_ll=37.5, lat_tr=38.0,
                         lon_ll=14.8, lon_tr=15.30,
                         topo_access_mode='srtm')
Add 2 GeoPoints to domain
Create GeoPoint at summit region of Mt. Etna and add to domain
etna = geonum.GeoPoint(latitude=37.751005,
                       longitude=14.993435,
                       altitude=3264.0,
                       name="Etna summit region")

domain.add_geo_point(etna)
Create GeoPoint for location of volcanological observatory at Mt. Etna and add to domain
observatory = geonum.GeoPoint(latitude=37.765755,
                              longitude=15.016696,
                              auto_topo_access=True,
                              name="Observatory")

domain.add_geo_point(observatory)
Retrieving SRTM data (this might take a while) ...
4 2884802
Load topographic data using SRTM database
topo = domain.load_topo_data()
Retrieving SRTM data (this might take a while) ...
4 2884802
4 2884802
4 2884802
Make a beautiful map of the GeoSetup
Note
the plotting features of geonum currently undergo revision, and thus, parts of the geonum plot API (geonum.plot_helpers) shown below is not finalised yet and may change. For details and updates related to the revision, see here: https://github.com/jgliss/geonum/issues/4
import matplotlib.pyplot as plt

# Initiate figure and cartopy GeoAxes for map plot
ax = geonum.plot_helpers.init_figure_with_geoaxes()

# Set x and y limits based on domain ranges
ax.set_xlim([domain.ll.longitude, domain.tr.longitude])
ax.set_ylim([domain.ll.latitude, domain.tr.latitude])

# Make a filled contour plot of the topography
ax, pdata = plot_topo_contourf(
    ax, # GeoAxes
    topo, # geonum.TopoData
    oceans_separate=True, # plot oceans in light blue
    levels=50, # number of vertical levels
    cmap='Oranges' # color map
)


# Add colorbar
cb = ax.figure.colorbar(pdata, label='Altitude [m]')

# Plot contour lines
ax.contour(
    *topo.init_mesh(),
    topo.data,
    levels=10,
    linestyles='--',
    linewidths=0.1,
    colors='k')

# Plot the 2 GeoPoints that were added to the GeoSetup
geonum.plot_helpers.plot_geopoint_into_map(ax,etna, color='w',
        marker='o',
        facecolor='none',
        s=16,
        annot_kwargs={'xytext': (etna.longitude, etna.latitude-0.05)})

geonum.plot_helpers.plot_geopoint_into_map(ax,observatory, color='w',
        marker='o',
        facecolor='none',
        s=16)

# Set title
ax.set_title(domain.id)

ax = geonum.plot_helpers.set_map_ticks(ax)
plt.show()
Total running time of the script: (0 minutes 2.592 seconds)